
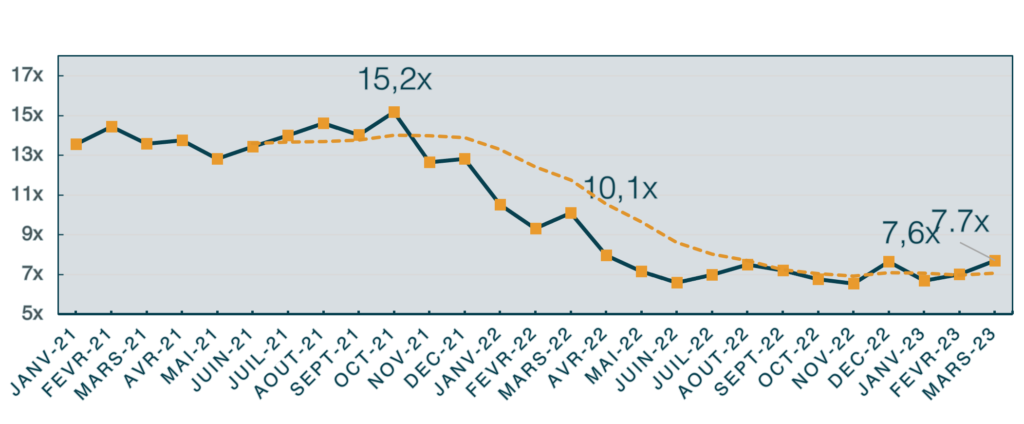
Our B2B SaaS index has stabilized in this first quarter.
After a significant decline in 2022, our B2B SaaS index stabilized in the first quarter of 2023 with an EV/Sales of 7,7x. In 2022, the financial markets were driven by central bank interest rate hikes and record inflation. The year 2023 will continue to be tied to inflation, the macroeconomic context, and the US Federal Reserve rate.
EV / Sales evolution
Index 2022 removals and additions
Private equity firms have been active in buying public SaaS in 2022. We have seen the delisting of 6 of our peer companies: Anaplan, Attraqt group, Avalara, Avast, Aveva group and Zendesk. To keep an index of 40 companies, we decided to replace them with the following companies: Clearwater analytics, Freshwork, Monday.com, Braze, Confluent and Ceridiant.
| Name | Country | Market Cap (EUR) | EV/SALES 2023 | EV/EBITDA 2023 | P/E 2023 |
| Adobe Inc. | US | 163 Bln | 9.10x | 18.50x | 25.10x |
| Alteryx, Inc. | US | 3.77 Bln | 4.68x | 53.40x | 130.40x |
| AppFolio, Inc. | US | 4.06 Bln | 7.45x | – | – |
| Atlassian Corporation Plc | AU | 40.4 Bln | 12.45x | 67.00x | 111.70x |
| ATOSS Software AG | DE | 1.32 Bln | 9.45x | 30.60x | 52.90x |
| BlackLine, Inc. | US | 3.73 Bln | 7.45x | 61.40x | 59.40x |
| Braze, Inc. | US | 3.06 Bln | 8.16x | – | – |
| Ceridian HCM Holding Inc. | US | 10.4 Bln | 8.16x | 33.10x | 55.50x |
| Clearwater Analytics Holdings, Inc. | US | 2.83 Bln | 8.17x | 30.40x | 43.30x |
| Confluent, Inc. | US | 6.45 Bln | 8.12x | – | – |
| Datadog, Inc. | US | 21.4 Bln | 10.67x | 62.80x | 62.90x |
| DocuSign, Inc. | US | 10.8 Bln | 4.54x | – | – |
| Dynatrace, Inc. | US | 11.3 Bln | 10.53x | 40.50x | 47.90x |
| Elastic N.V. | US | 5.14 Bln | 4.99x | – | – |
| Everbridge, Inc. | US | 1.28 Bln | 3.75x | 20.20x | 20.90x |
| Freshworks Inc. | US | 4.1 Bln | 5.76x | – | – |
| GitLab Inc. | US | 4.79 Bln | 10.16x | – | – |
| GK Software SE | DE | 430 Mio | 2.48x | 12.50x | 25.30x |
| HubSpot, Inc. | US | 19.5 Bln | 9.94x | 64.00x | 94.70x |
| Matterport, Inc. | US | 731 Mio | 2.00x | – | – |
| monday.com Ltd. | IL | 6.27 Bln | 8.70x | – | – |
| Nemetschek SE | DE | 7.31 Bln | 8.74x | 29.90x | 47.00x |
| New Relic, Inc. | US | 4.77 Bln | 5.34x | 58.00x | – |
| PagerDuty, Inc. | US | 2.94 Bln | 8.15x | – | – |
| Paycom Software, Inc. | US | 16.2 Bln | 10.15x | 24.60x | 40.20x |
| Salesforce inc. | US | 184 Bln | 6.30x | 36.30x | – |
| ServiceNow, Inc. | US | 86.8 Bln | 10.15x | 31.30x | 50.00x |
| Sidetrade SA | FR | 183 Mio | 4.10x | 30.50x | 43.60x |
| Smartsheet Inc. | US | 5.83 Bln | 7.75x | – | – |
| Splunk Inc. | US | 14.6 Bln | 4.91x | – | – |
| TeamViewer AG | DE | 2.77 Bln | 5.16x | 10.40x | 20.10x |
| The Sage Group plc | UK | 9 Bln | 4.01x | 17.30x | 26.10x |
| UiPath Inc. | US | 9.01 Bln | 7.64x | – | – |
| Unity Software Inc. | US | 11.2 Bln | 6.48x | 54.50x | 80.10x |
| Veeva Systems Inc. | US | 27 Bln | 12.22x | 53.90x | 60.20x |
| Wix.com Ltd. | Other | 4.86 Bln | 3.38x | 41.20x | 54.20x |
| Workday, Inc. | US | 49.2 Bln | 8.10x | – | – |
| Workiva Inc. | US | 5 Bln | 8.60x | – | – |
| Yext, Inc. | US | 1.08 Bln | 2.75x | – | – |
| Zuora, Inc. | US | 1.21 Bln | 3.01x | – | – |
| Median | 7.70x | 33.10x | 50.00x |
Here, we focus on European-born leaders like: Datadog, Elastic, Talend, TeamViewer, The Sage Group,…
For this index, we choose to report quarterly in order to take a medium-term view of the market. Feel free to interact with us to enrich this exercise. We hope you find it useful in these special times.
If you have any questions regarding a SaaS business valuation, do not hesitate to Contact us.