
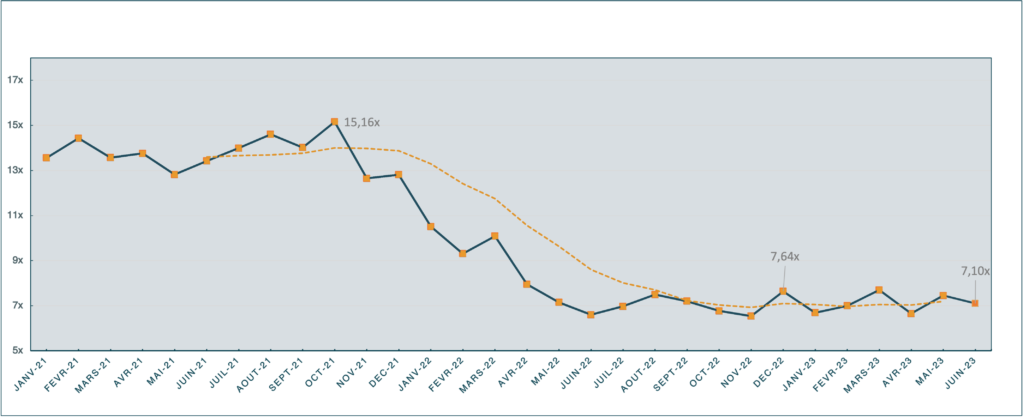
Our B2B SaaS index has stabilized over the last few quarters.
Our B2B SaaS index has stabilized in the first half year of 2023 with a median at EV/Sales of 7,1x. The current level seems the be the new normal after a buoyant period in 2021, mainly driven by interest rates and monetary policy.
EV/Sales
Index background
At E-Spring, we like to keep an eye on the public SaaS companies. The market data gives us good insights when we are valuing a private SaaS company. In a way, it’s always connected to the market. It shows the trends and the confidence in the sector. Who are the champions of the league. So, we decided to create our own SaaS index of 40 companies that we selected as being as much as possible representative of the SaaS B2B market, keeping a right balance between US and Europe (European-founded public SaaS companies).
Our basket is, of course, partial and has no intention of perfectly reflecting the entire SaaS public landscape. Our aim is to give an outlook of the market with a more balanced index than what is available with the US Nasdaq SaaS index. More than 100 Public SaaS companies are available.
| Name | Country | Market Cap (EUR) | EV/SALES 2023 | EV/EBITDA 2023 | P/E 2023 |
| Adobe Inc. | US | 200 Bln | 11.27x | 22.50x | 30.50x |
| Alteryx, Inc. | US | 2.84 Bln | 3.69x | 30.40x | 59.10x |
| AppFolio, Inc. | US | 5.42 Bln | 10.01x | – | – |
| Atlassian Corporation Plc | AU | 39.8 Bln | 12.35x | 59.10x | 95.20x |
| ATOSS Software AG | DE | 1.72 Bln | 12.08x | 39.00x | 65.80x |
| BlackLine, Inc. | US | 3.02 Bln | 6.19x | 38.40x | 35.00x |
| Braze, Inc. | US | 3.64 Bln | 10.04x | – | – |
| Ceridian HCM Holding Inc. | US | 9.4 Bln | 7.28x | 29.00x | 53.10x |
| Clearwater Analytics Holdings, Inc. | US | 2.8 Bln | 8.15x | 30.30x | 41.80x |
| Confluent, Inc. | US | 9.31 Bln | 12.31x | – | – |
| Datadog, Inc. | US | 27.8 Bln | 14.05x | 74.50x | 74.10x |
| DocuSign, Inc. | US | 9.39 Bln | 3.95x | – | – |
| Dynatrace, Inc. | US | 13.5 Bln | 12.40x | – | 137.50x |
| Elastic N.V. | US | 5.63 Bln | 5.47x | – | – |
| Everbridge, Inc. | US | 985 Mio | 3.06x | 16.50x | 16.30x |
| Freshworks Inc. | US | 4.39 Bln | 6.32x | – | – |
| GitLab Inc. | US | 6.92 Bln | 15.78x | – | – |
| GK Software SE | DE | 438 Mio | 2.36x | 14.80x | 32.00x |
| HubSpot, Inc. | US | 23.5 Bln | 11.98x | 72.20x | 101.80x |
| Matterport, Inc. | US | 802 Mio | 2.48x | – | – |
| monday.com Ltd. | IL | 7.7 Bln | 10.83x | – | – |
| Nemetschek SE | DE | 8.01 Bln | 9.50x | 32.40x | 50.90x |
| New Relic, Inc. | US | 4.32 Bln | 4.78x | – | – |
| PagerDuty, Inc. | US | 1.83 Bln | 4.95x | – | – |
| Paycom Software, Inc. | US | 16.2 Bln | 10.16x | 24.30x | 39.70x |
| Salesforce inc. | US | 190 Bln | 6.55x | 37.80x | – |
| ServiceNow, Inc. | US | 102 Bln | 12.18x | 37.80x | 56.90x |
| Sidetrade SA | FR | 183 Mio | 4.33x | 33.70x | 56.90x |
| Smartsheet Inc. | US | 4.63 Bln | 6.11x | – | – |
| Splunk Inc. | US | 15.8 Bln | 5.30x | – | – |
| TeamViewer AG | DE | 2.48 Bln | 4.64x | 11.70x | 19.30x |
| The Sage Group plc | UK | 10.3 Bln | 4.44x | 17.60x | 27.90x |
| UiPath Inc. | US | 8.23 Bln | 6.92x | – | – |
| Unity Software Inc. | US | 13.1 Bln | 7.39x | 58.00x | 73.60x |
| Veeva Systems Inc. | US | 29.2 Bln | 13.45x | 59.40x | 65.70x |
| Wix.com Ltd. | Il | 4.09 Bln | 2.84x | 27.50x | 33.10x |
| Workday, Inc. | US | 52.5 Bln | 8.75x | – | – |
| Workiva Inc. | US | 4.88 Bln | 8.44x | – | – |
| Yext, Inc. | US | 1.32 Bln | 3.44x | – | – |
| Zuora, Inc. | US | 1.41 Bln | 3.58x | – | – |
| Median | 7.10x | 32.40x | 50.90x |